Cambridge 19 Test 1
WRITING TASK 1
You should spend about 20 minutes on this task.
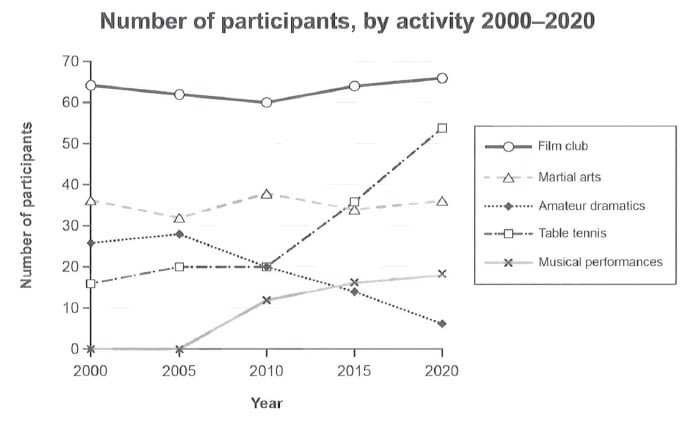
The graph below gives information on the numbers of participants for different activities at one social centre in Melbourne, Australia for the period 2000 to 2020.
Summarise the information by selecting and reporting the main features, and make comparisons where relevant.
Write at least 150 words.
Cambridge 19 Test 2
WRITING TASK 1
You should spend about 20 minutes on this task.
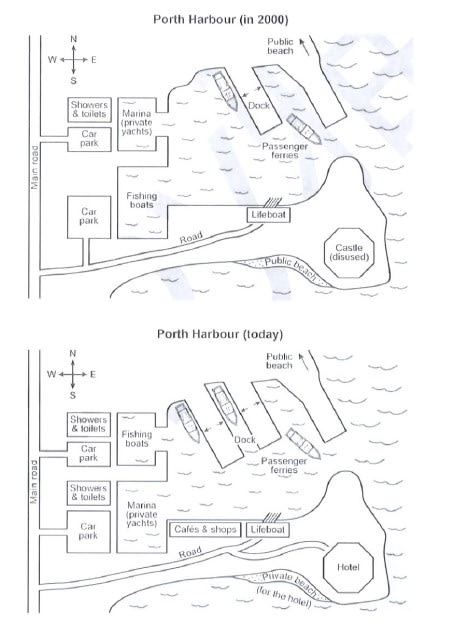
The plans below show a harbour in 2000 and how it looks today.
Summarise the information by selecting and reporting the main features, and make comparisons where relevant.
Write at least 150 words.
Cambridge 19 Test 3
WRITING TASK 1
You should spend about 20 minutes on this task.
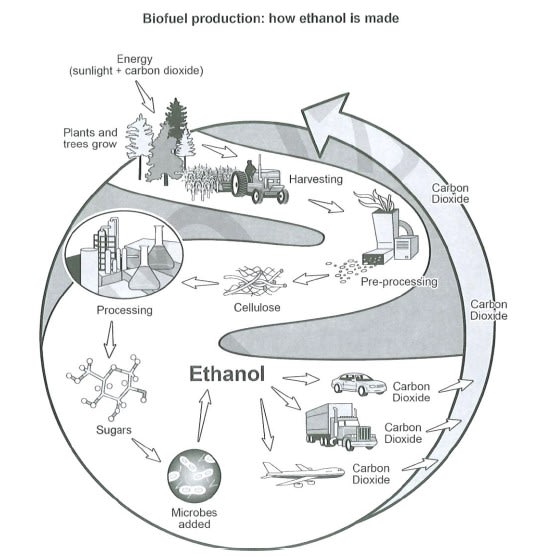
The diagram below shows how a biofuel called ethanol is produced.
Summarise the information by selecting and reporting the main features, and make comparisons where relevant.
Write at least 150 words.
Cambridge 19 Test 4
WRITING TASK 1
You should spend about 20 minutes on this task.
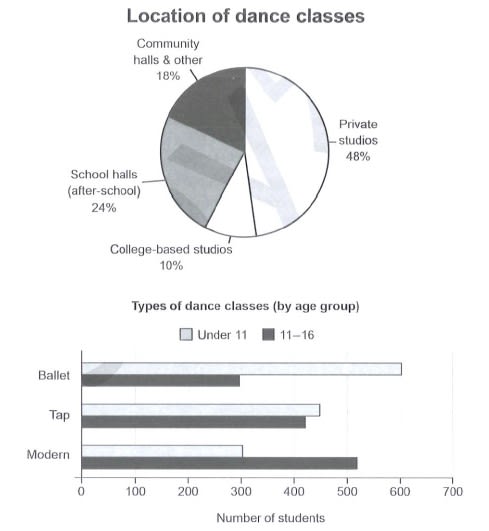
The charts below give information on the location and types of dance classes young people in a town in Australia are currently attending.
Summarise the information by selecting and reporting the main features, and make comparisons where relevant.
Write at least 150 words.